
Retail operations · 2026-06-30 · 4 min read
How 3D visualization helps furniture retailers reduce returns
The most common cause of furniture returns is expectation mismatch, not product quality. Here is how showing the right product in real context cuts that risk.
Why does furniture get returned?
Most furniture returns do not happen because the product is defective. They happen because the sofa was larger than the buyer imagined, the finish looked different in natural light than it did in the showroom, or the piece simply did not fit the room the way the buyer pictured. These are expectation failures, not product failures.
A return costs a retailer the logistics of collection, the cost of inspecting and repackaging the item, and often the sale itself as the buyer loses confidence. Reducing returns by even a few percentage points has a meaningful impact on margin.
The categories most prone to this problem are the ones hardest to judge from a showroom floor: large upholstered pieces, case goods sized for a specific room, and anything where finish color shifts noticeably under different lighting. These are exactly the items where a buyer's mental image and the delivered reality are most likely to diverge.
Buying in context means buying with confidence
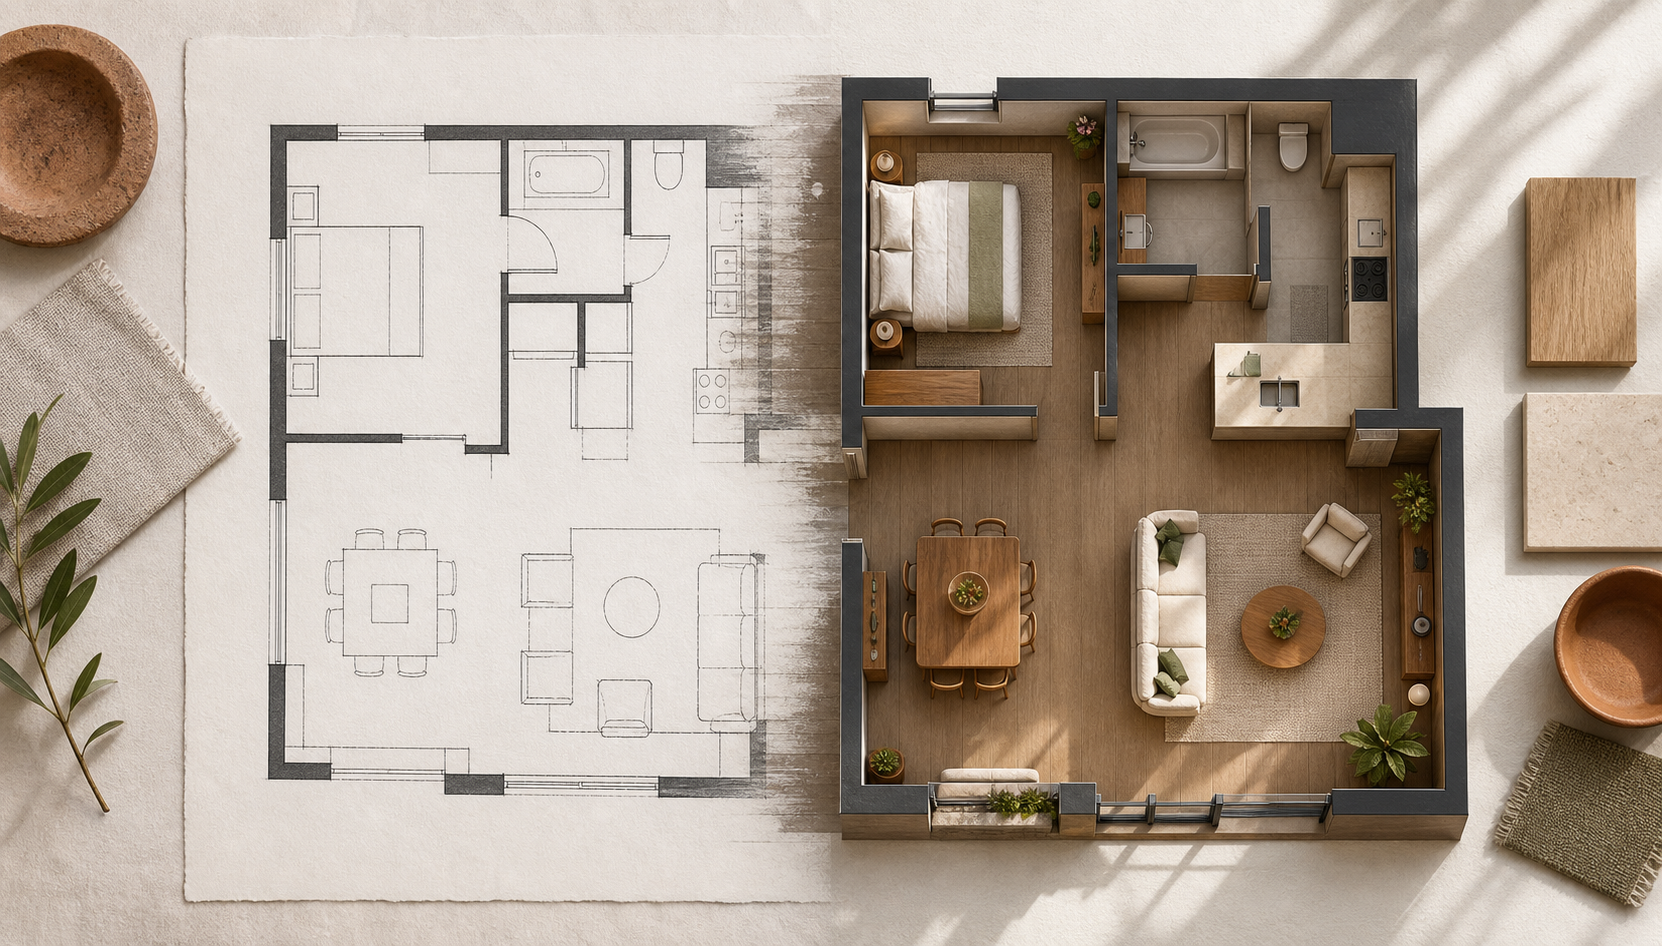
When a buyer can place a sofa into a 3D version of their actual room — with the right dimensions, the right finish, and the right light — they make a decision that is grounded in reality, not imagination. The result is fewer surprises at delivery and fewer returns.
FurnViz lets retailers offer this experience at any stage of the buying journey: in the showroom on a tablet, via a shared link sent after a consultation, or embedded in a product page. The buyer sees the real product in their real space before committing.
This flexibility matters because the moment of doubt that leads to a return often happens after the showroom visit, at home, while the buyer is reconsidering the purchase. A shareable 3D scene the buyer can revisit that evening addresses the doubt at the moment it actually occurs, rather than only during the sales conversation.
What changes for retailers, studios, and finishing companies
Retailers using 3D visualization also report shorter sales conversations. When the visual evidence removes uncertainty, buyers need less reassurance from sales staff and reach a decision faster.
Return-reduction programs that pair 3D visualization with clear return-reason tracking tend to improve fastest, because the retailer can see exactly which categories still generate returns and check whether those categories are being shown in 3D consistently or skipped because staff find them harder to set up in the tool.
Finishing companies and studios see a related benefit on a larger scale: a client who approves an entire room's furniture and finishes inside a 3D walkthrough is far less likely to request costly changes mid-project, because the approval was based on seeing the actual combination rather than separate samples viewed in isolation.
The retailers who get the most value from this approach treat the 3D scene as part of the order record, not just a sales aid. When the exact configuration the buyer approved is saved and attached to the order, delivery and installation teams work from the same reference the buyer signed off on, closing the loop between what was promised and what arrives.
Make measurement and training part of the rollout
Reducing returns is ultimately about closing the gap between what a buyer imagines and what a retailer delivers. The smaller that gap, the fewer returns, the shorter the sales cycle, and the more confident the buyer feels recommending the retailer to someone else.
Staff training plays a bigger role in return rates than most retailers assume. A salesperson who treats the 3D walkthrough as an optional extra for hesitant customers will only capture the return-reduction benefit for a small slice of sales. Retailers who see the largest drop in returns make the 3D scene a standard part of every order above a certain size, not an exception offered only when a buyer asks for it.
It is worth measuring this properly before and after rollout. Track returns by category and reason code for a full sales cycle before introducing 3D visualization, then compare the same categories for a full cycle after staff are trained and using it consistently. The categories that were previously highest-risk for size or color mismatch are usually where the improvement shows up first and most clearly.
Retailers should also check that the exchange process itself gets easier alongside fewer returns. When a customer does need to swap a product, having the original 3D scene on file means staff can immediately show a same-size alternative in the same room, turning a potential refund into a straightforward exchange instead.
Related reading